See exactly what you get
A full report from the engine we use for clients, run on a fictional drinks company. Eleven pages, plus an Excel workbook with a scenario model you can edit.
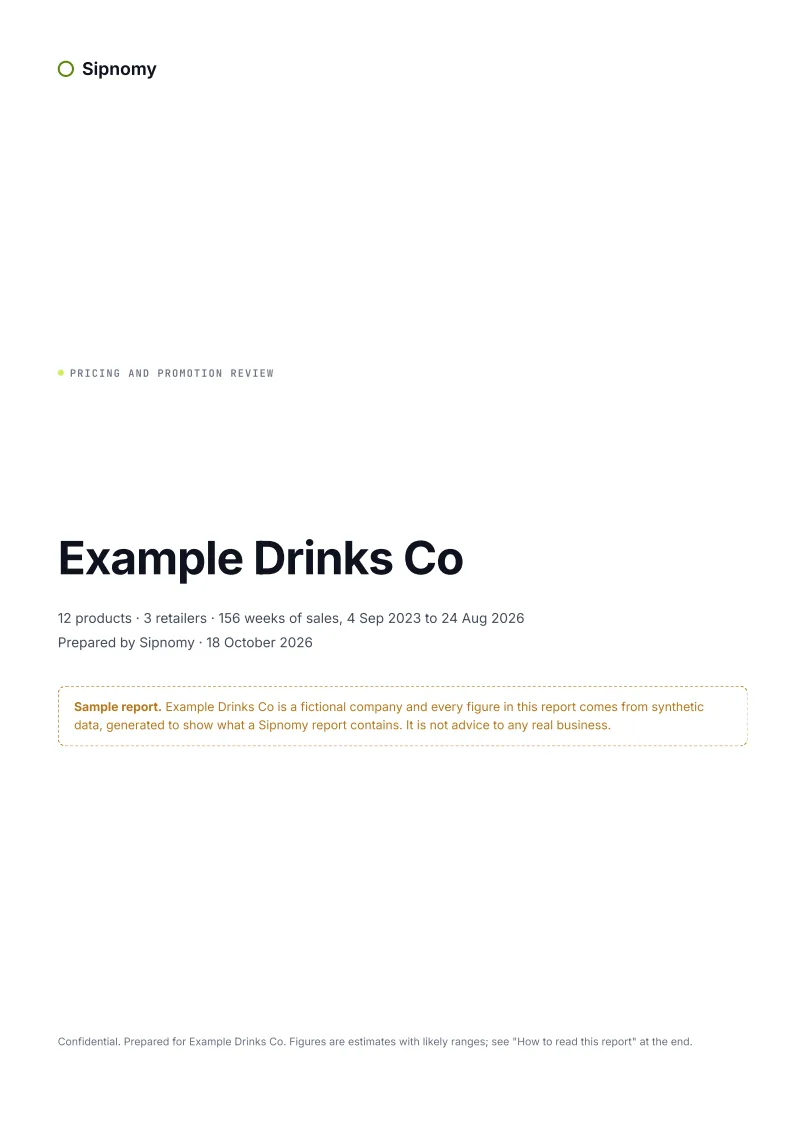
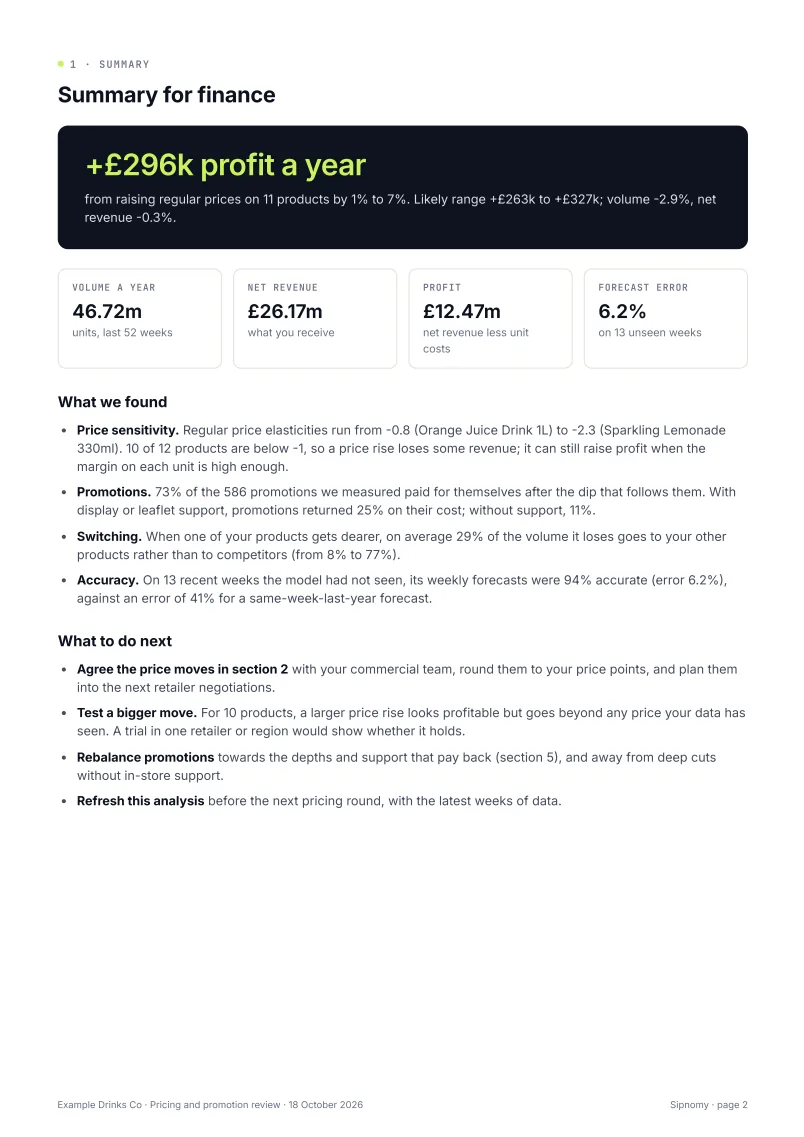
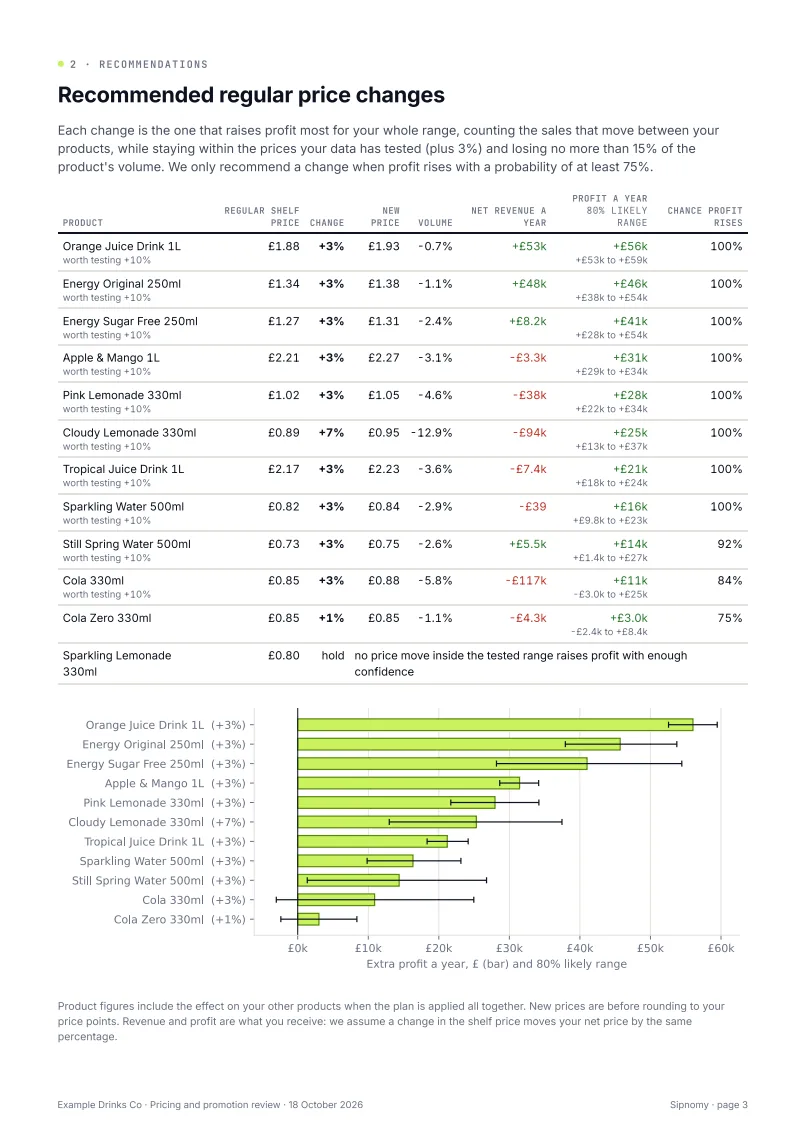
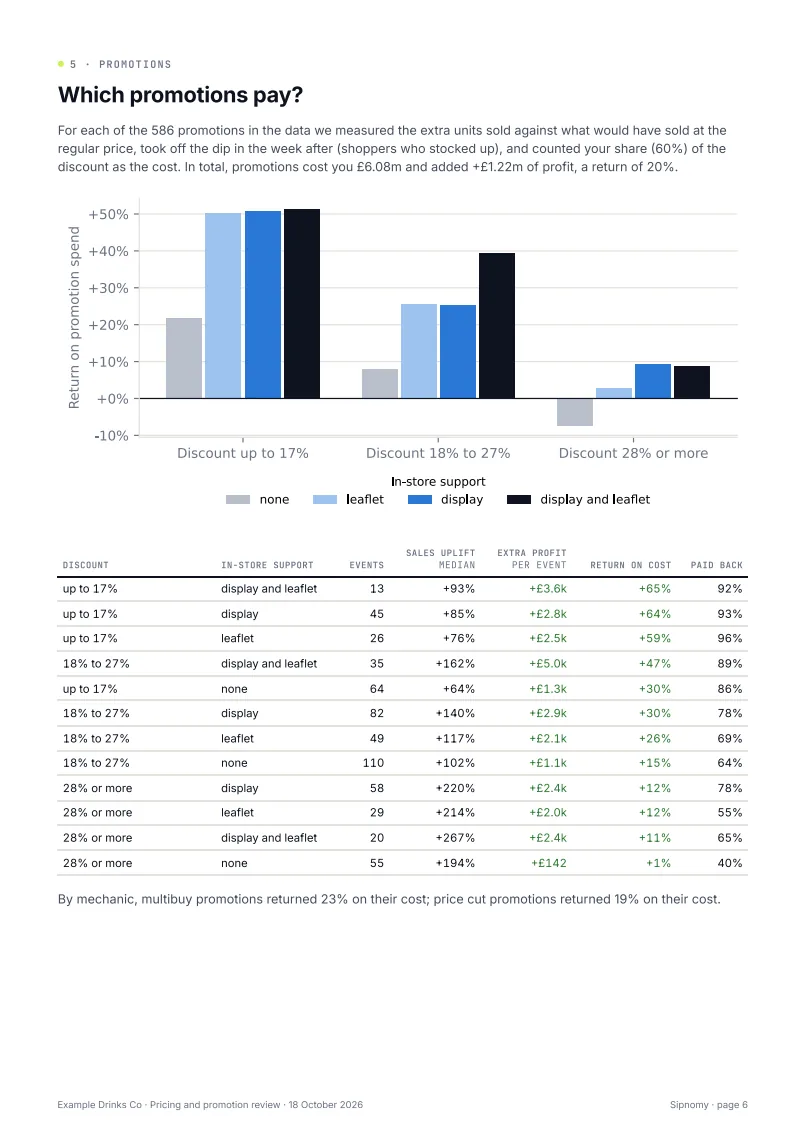
Example Drinks Co is fictional: its sales are synthetic, built to behave like real drinks sales with real UK weather and bank holidays.
The headline in this example
profit a year from small regular price rises on 11 of 12 products, with volume down about 3%.
of 586 promotions paid for themselves after the dip that follows them.
price elasticity from the least to the most price-sensitive product.
Three steps
- Your dataWeekly sales by product and retailer (two years is ideal), your unit costs and net prices, and your promotions. What we ask for
- One model of your salesIt separates the effect of price from promotions, switching between your products, competitors, distribution, weather and the calendar, product by product and retailer by retailer. Every figure comes with a likely range.
- Decisions in profitWe recommend a price change only when profit rises with at least a 75% chance, and only close to prices you have already charged. Promotions are judged after the dip that follows them.
Tested before you see a number
average error predicting weeks the model hadn't seen, against 43% for a same-week-last-year forecast.
of our 90% likely ranges contained the true value, on 240 test products with known answers.
of your latest sales are held back and predicted, so every report shows its own accuracy.
The model assumes competitors and retailers respond as they have before, and it can only measure prices that have actually moved. Each report states these limits next to the figures they affect.